
Ultrasound Workshop – The FALLS Protocol
Massive thanks to our guest speaker Dr Chris Partyka from The Blunt Dissection for delivering an excellent workshop on critical care ultrasound! The content from his workshop, including the FALLS protocol for undifferentiated shock, is available here.
Advanced ECG Workshop – Chest Pain
Below are the images from the ECG workshop on chest pain, along with some learning points discussed on the day. Follow the links for more information on each individual topic.
ECG 1
- Peaked T waves + upsloping ST depression in the precordial leads = the De Winter ECG pattern. This is a sign of acute LAD occlusion and should be treated as a STEMI equivalent.
- Also note the ectopic atrial rhythm — P wave inversion in II, III + aVF.
Read more about De Winter’s T waves here.
ECG 2 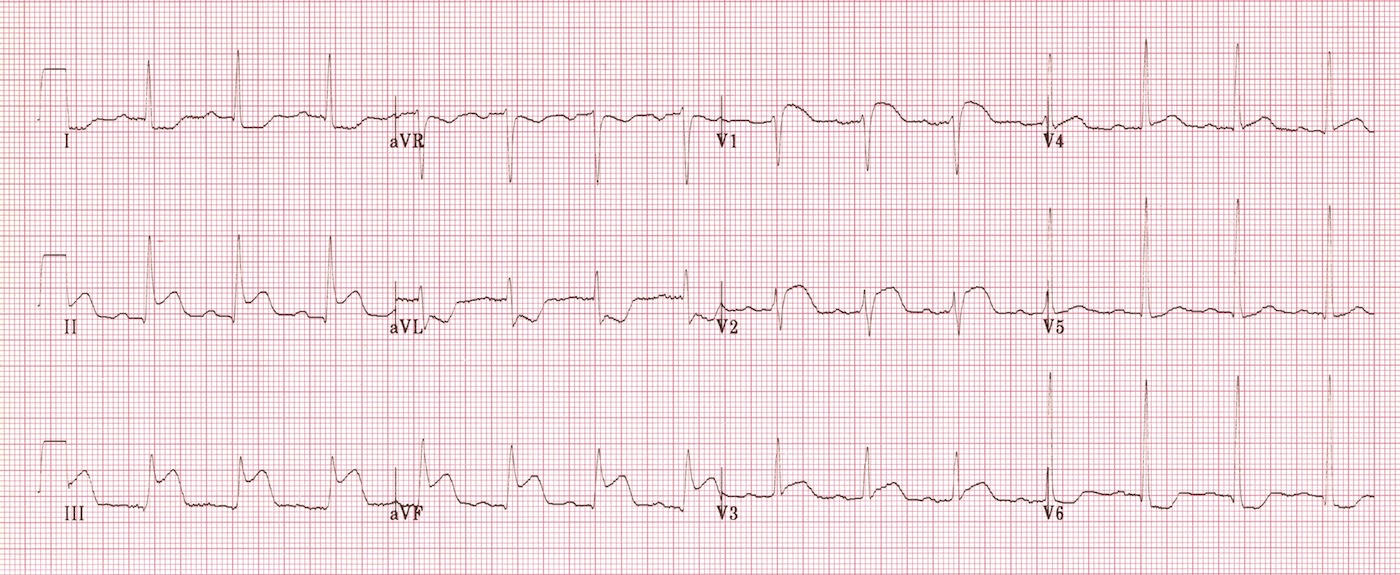 Inferior STEMI with reciprocal change. There are additional signs of right ventricular infarction:
- STE in III > II
- STE in V1-2
This rightward vector of the injury current (III > II) suggests an RCA occlusion rather than a LCx occlusion. Repeat ECG with a V4R lead position confirms a right ventricular infarction (STE in V4R). 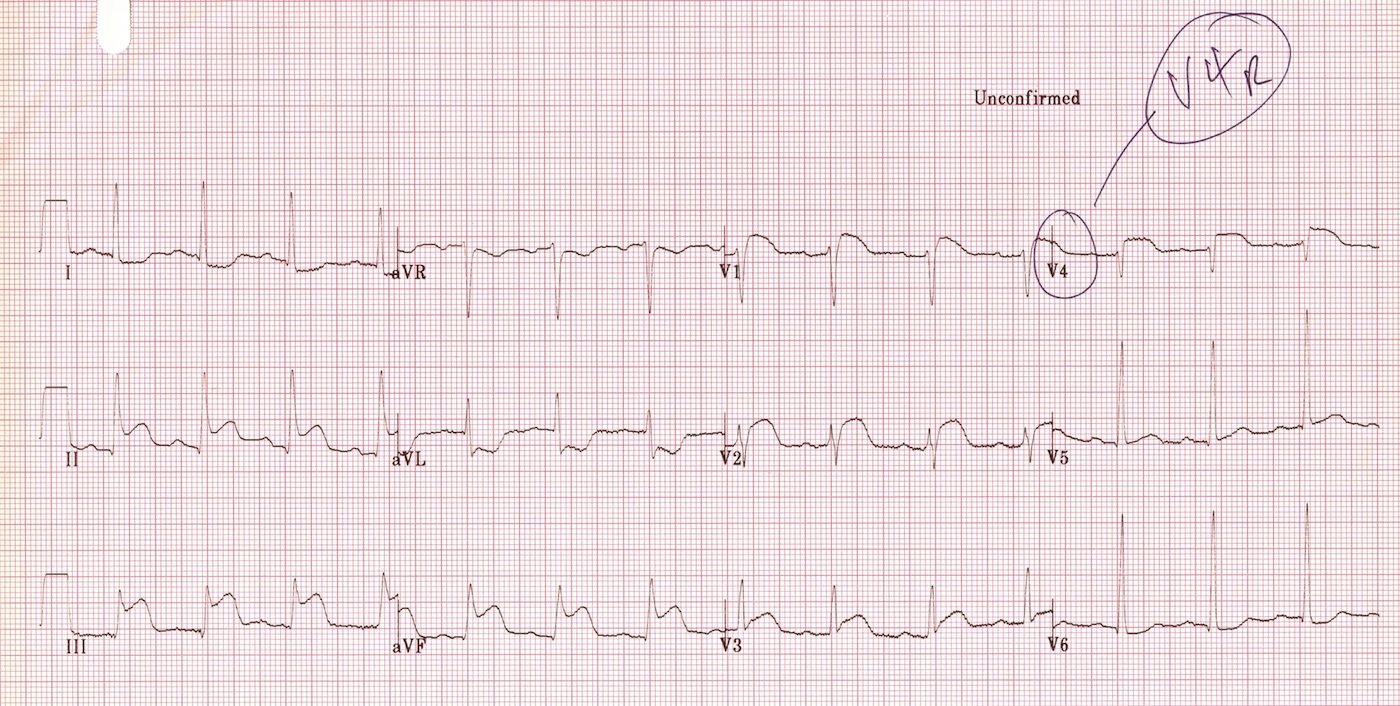 Read more about right ventricular infarction here.
ECG 3 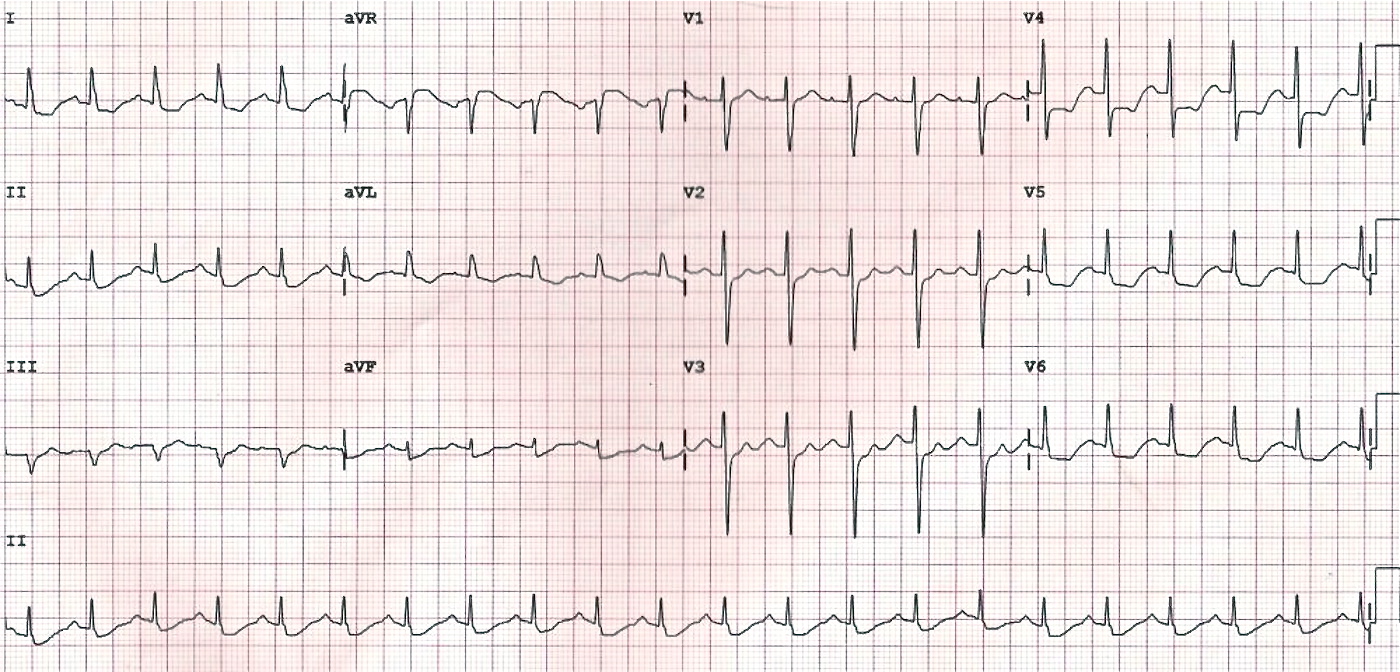 There is evidence of global subendocardial ischaemia, suggestive of LMCA occlusion or severe triple vessel disease:
- Widespread horizontal ST depression, most prominent in the leftward-facing leads I, II and V4-6
- STE in aVR > 1mm
- STE in aVR > V1
Differential diagnoses for widespread ST depression include hypokalaemia and rate-related changes with SVT. Read more about LMCA occlusion here.
ECG 4 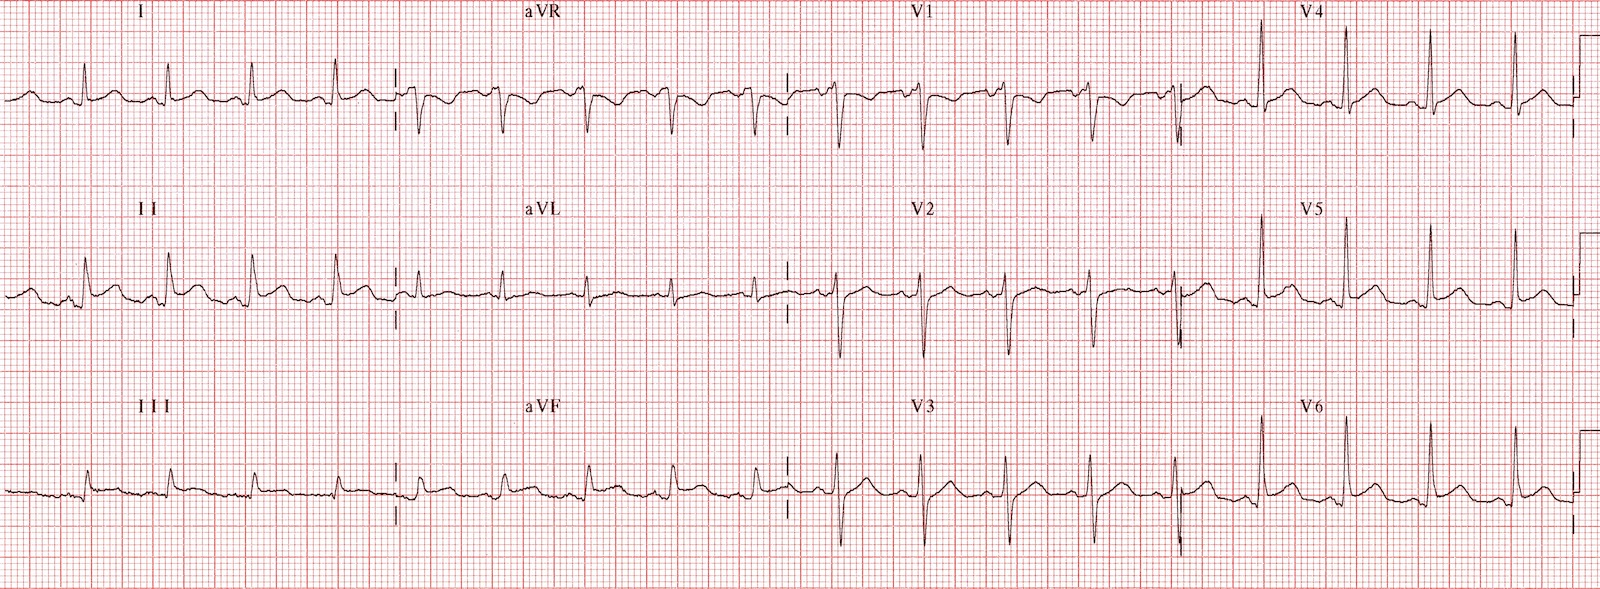 This ECG is a classic example of acute pericarditis. Positive findings include:
- Widespread concave (“saddleback”) ST elevation
- Widespread PR segment depression
- Spodick’s sign — a down-sloping TP segment that gives the baseline a kind of “zig-zag” appearance
- ST segment / T wave height ratio > 0.25 in V6, which favours a diagnosis of pericarditis over benign early repolarization.
Read more about pericarditis vs BER here. Amal Mattu gives some great tips on differentiating pericarditis from STEMI here.
ECG 5 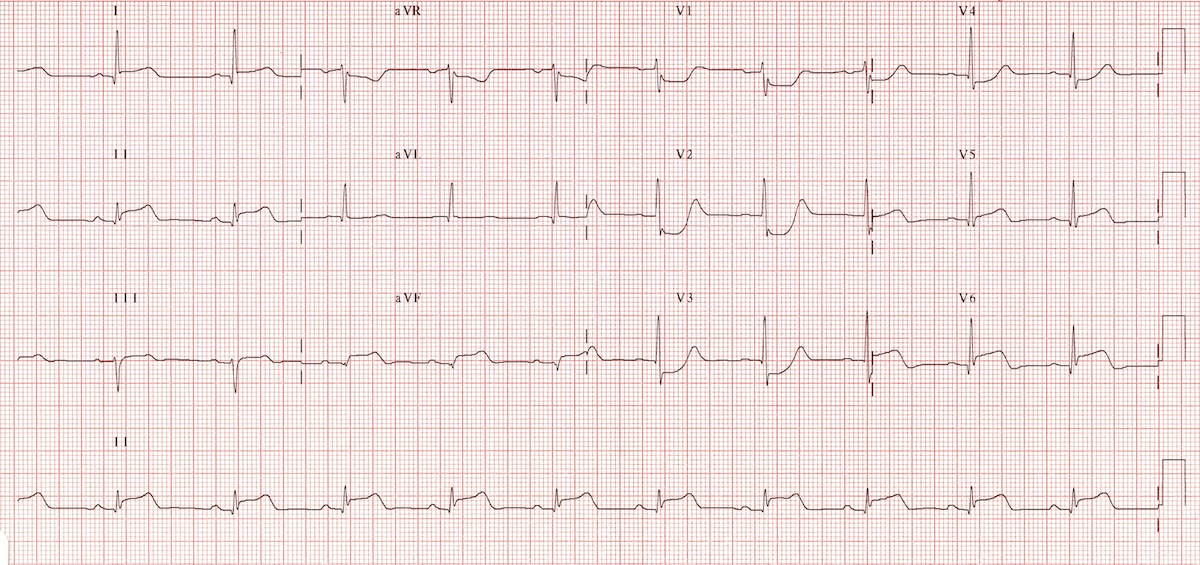 This ECG demonstrates an extensive infero-postero-lateral STEMI:
- ST elevation in II, III, aVF (inferior) plus leads I, V5-6 (lateral)
- ST depression in V1-3 with evolving dominant R waves (Q wave equivalent) and terminal T wave positivity = signs of posterior infarction
The leftward-facing injury vector suggests LCx rather than RCA occlusion, as recognised by:
- STE in II > III
- STE in I, V5-6
Repeat ECG with posterior leads (V7-9) confirms posterior wall infarction. 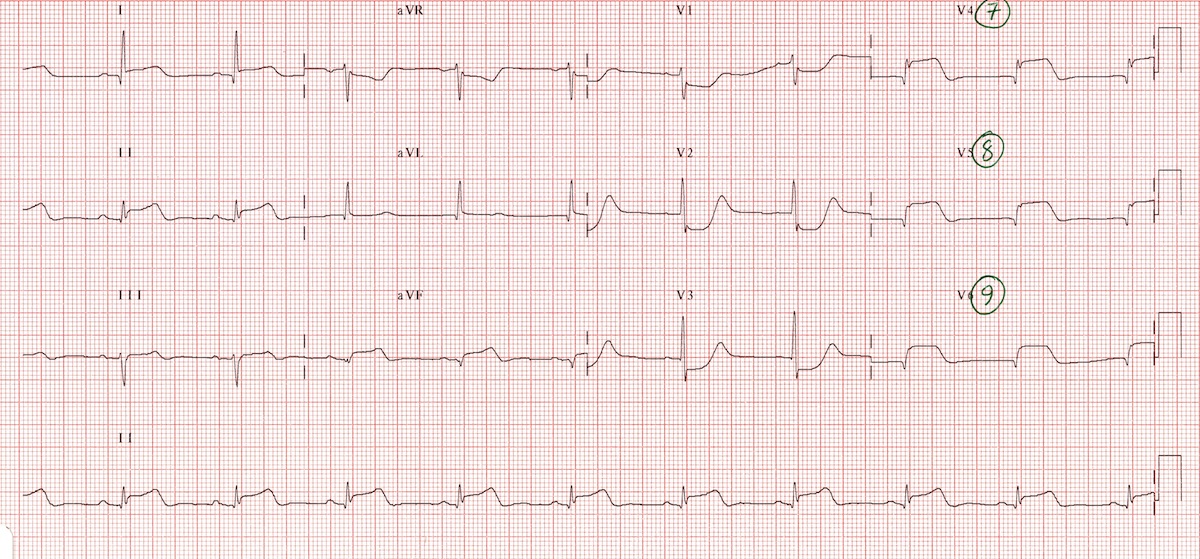 Read more about posterior infarction here.
ECG 6 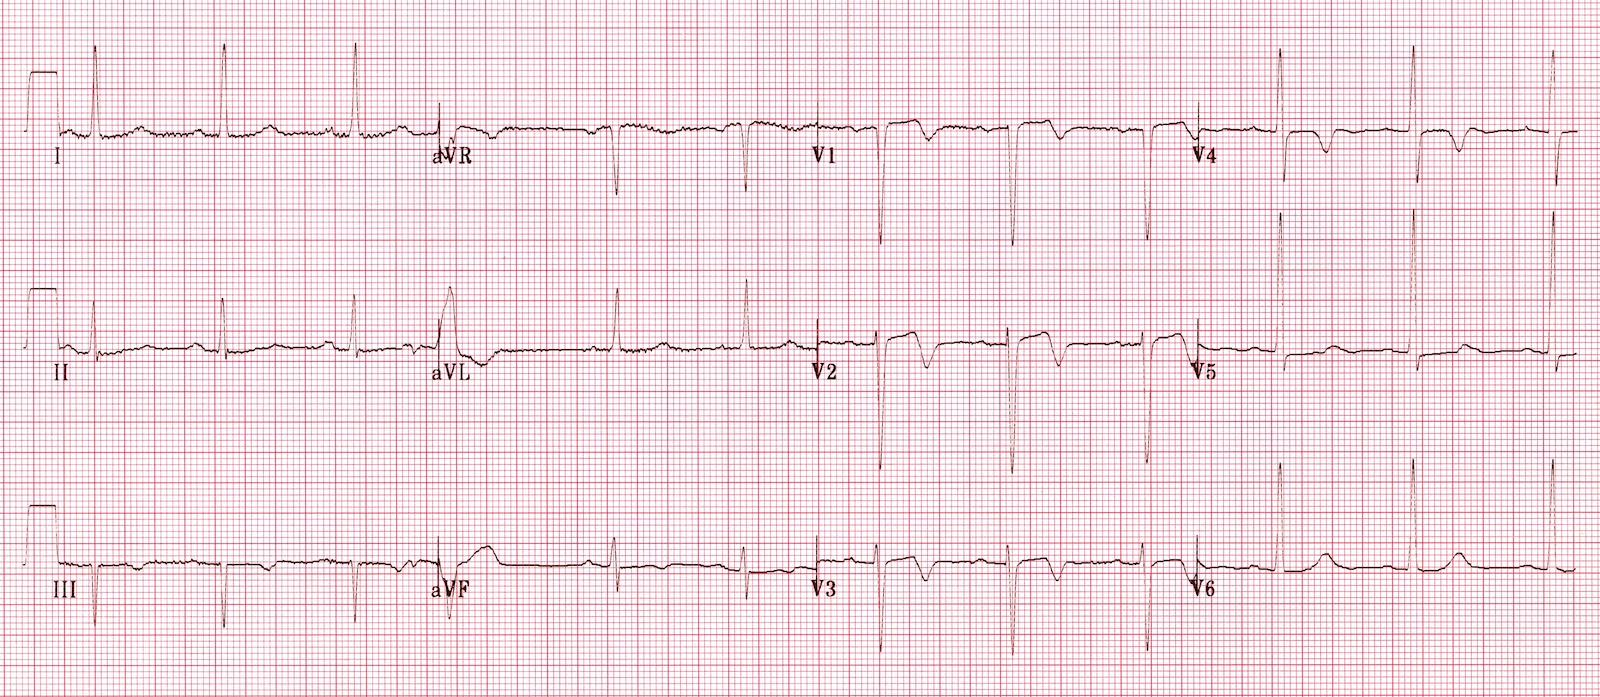
- Biphasic T waves in V1-3 (inverted in V4) typical of Wellens’ syndrome
- This ECG pattern is highly specific for a critical occlusion of the LAD.
Read more about Wellens’ syndrome here.
ECG 7 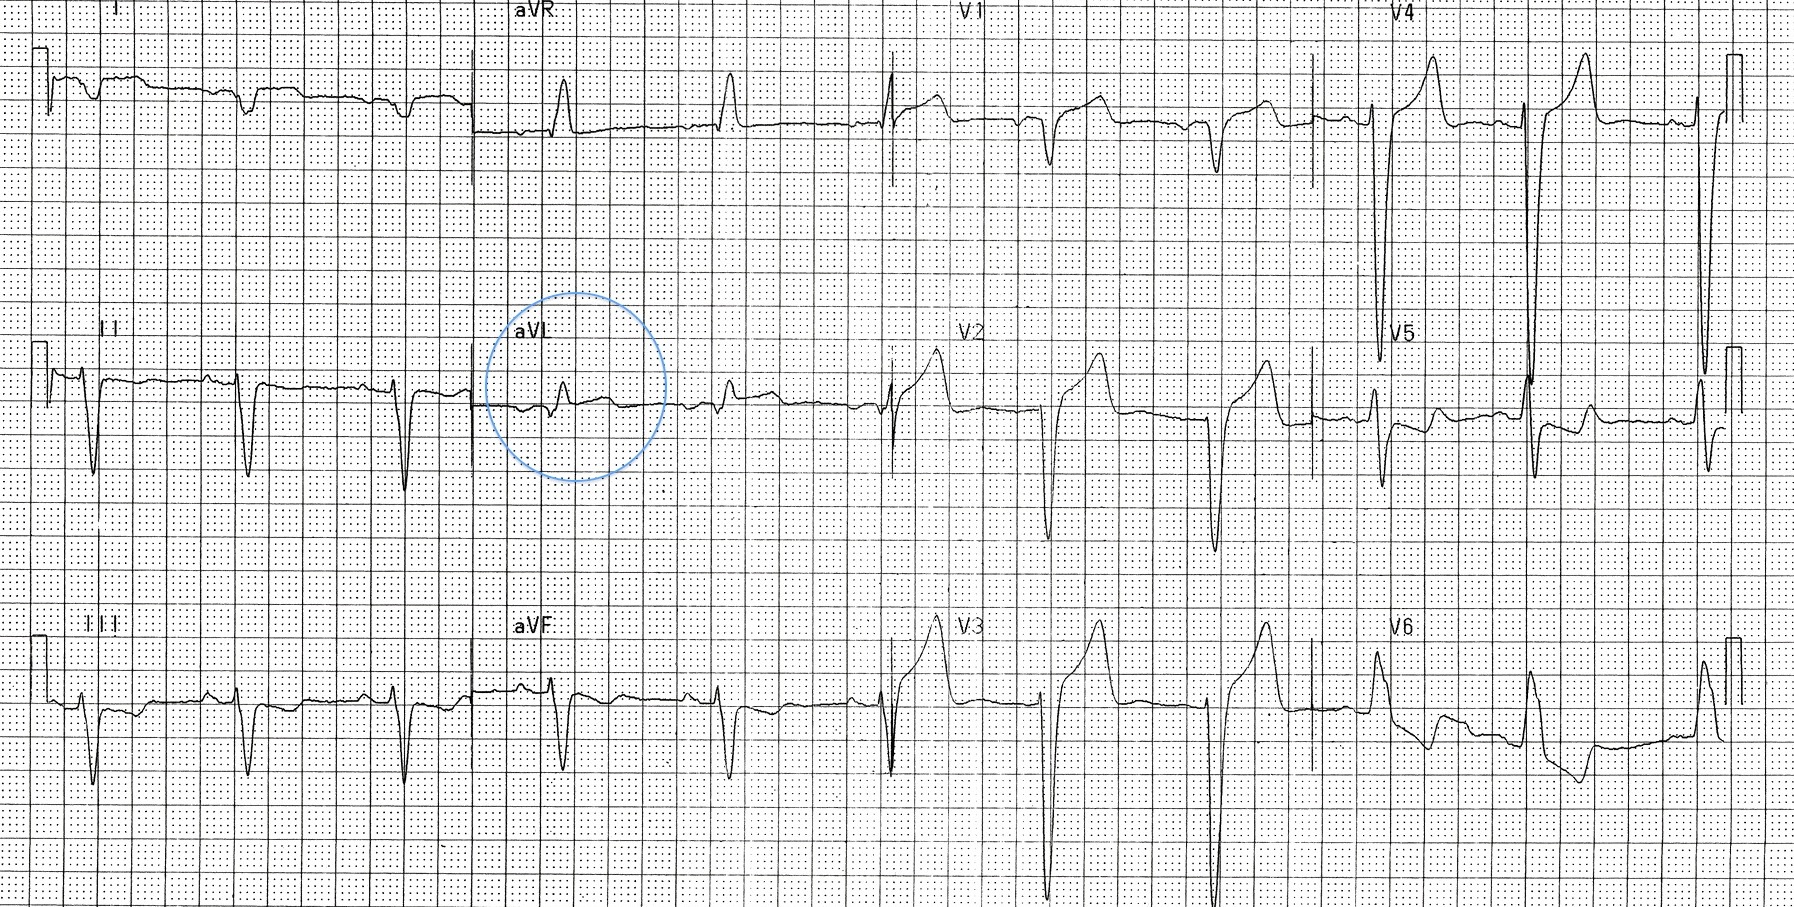 This ECG demonstrates LBBB with positive Sgarbossa criteria, indicating superimposed myocardial infarction:
- Concordant ST elevation in aVL
- Concordant ST depression / T wave inversion in II, III, aVF
- Additional concordant ST depression in V5
The pattern is suggestive of anterolateral STEMI with inferior reciprocal change. Sgarbossa criteria for diagnosing MI in the presence of LBBB or paced rhythm include:
- Concordant ST elevation > 1mm in any lead
- Concordant ST depression > 1mm in V1-3
- Excessively discordant ST elevation = ST elevation > 5mm (original Sgarbossa rule) or > 25% of S wave height (modified Smith rule)
Read more about the Sgarbossa criteria here.
ECG 8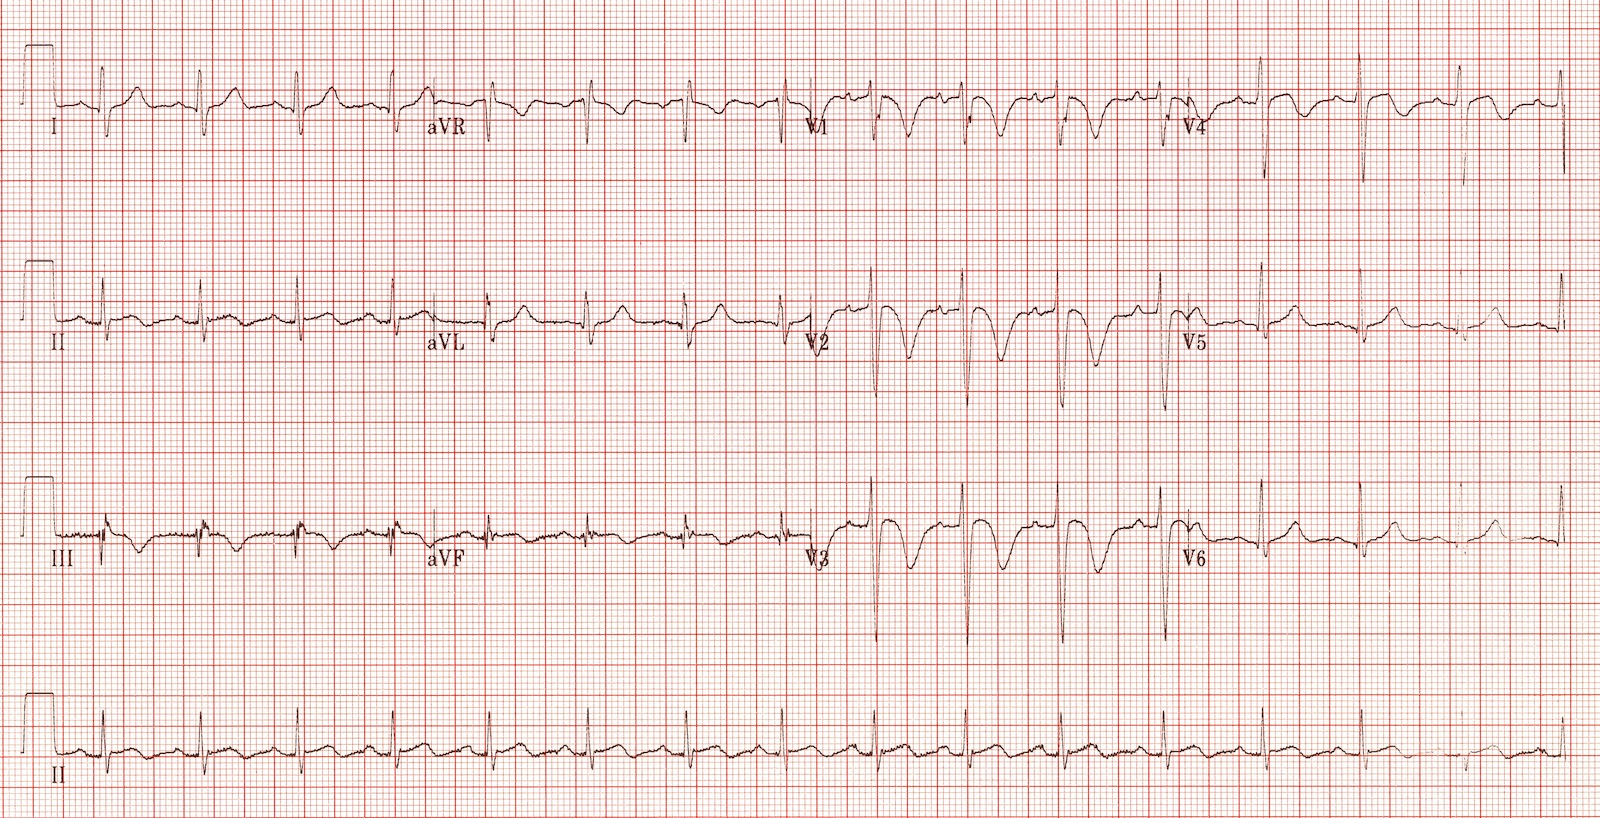 This is an ECG of pulmonary embolism with right heart strain, demonstrating:
- Sinus tachycardia (present in ~50% of patients with PE)
- The right ventricular strain pattern = Simultaneous T-wave inversions in the right precordial (V1-3) and inferior leads (III, aVF)
- Minor, non-specific ST changes in multiple leads
Other ECG changes seen with PE include:
- Right axis deviation
- Complete or incomplete RBBB
- Dominant R wave in V1
- S1 Q3 T3 = neither sensitive nor specific for PE; found in only ~20% of patients
Read more about ECG changes in PE here.
ECG 9 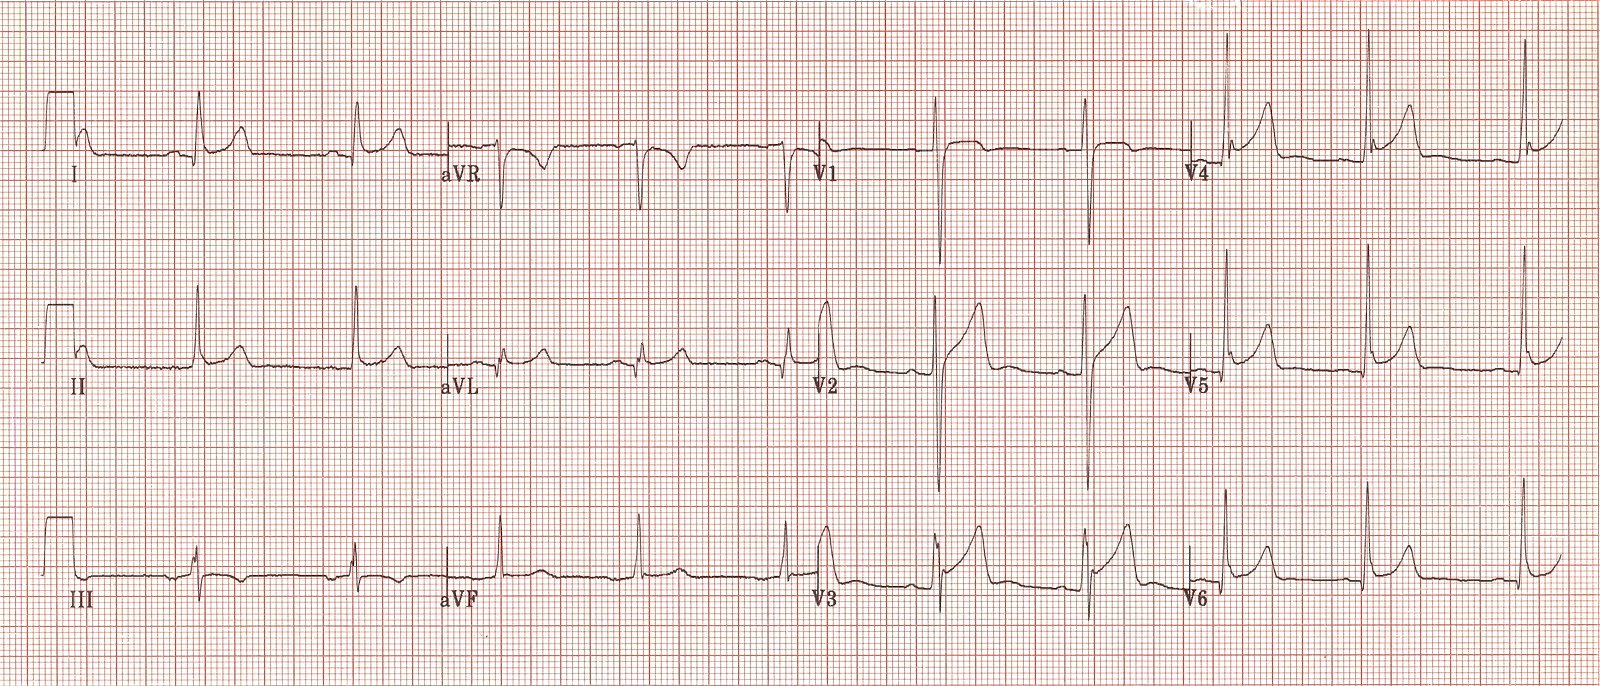 This is an example of benign early repolarization, demonstrating:
- Concave (“saddleback”) ST elevation in multiple leads, most prominent in the precordial leads.
- J-point notching (the “fish-hook pattern”) in V4.
- ST segment / T wave height ratio < 0.25 in V6, which favours BER over pericarditis.
- No features of acute STEMI — the T-wave inversion in III is a normal variant.
Read more about benign early repolarization here.

